


Education And Technology
Gamified Learning Platform
Gamified learning platform with clear learning journeys, deepening learning outcomes and reducing reliance on first-line support functions.
90%+Learners actively progressing
Octalysis 5-Step Design · Step 1
Define your key business processes and objectives to design a new custom-tailored experience.
Before any design work starts, this step pins down six things: the Business Metrics, Player Types, Desired Actions, Win-State, Feedback Mechanics and Rewards.
The end results, stated so they can be measured and ranked by importance. You can move several, but you design for the top one: metrics trade off against each other, like new sign-ups against returning log-ins.
Who the users are, beyond demographics: what they value, and which Core Drives move them to act or hold them back. For example, an accountant and a musician are moved by different things, so they won’t respond to the same design.
Every step users should take to improve the Business Metrics, in order, until it forms a full activity loop. List even the smallest steps, because people can drop out at any one of them.
Where each chain of Desired Actions pays off for the player, phase by phase through the journey: Discovery, Onboarding, Scaffolding and Endgame.
How players keep track of their progress toward Win-States (points, levels, stages, trophies, avatars), and the vehicles that carry it: the app, the website, email, customer service.
Incentives within your power to give, tied back to the 8 Core Drives through the SAPS model: Status, Access, Power and Stuff. In our research, boosters (a form of Power) are usually the most effective.
Output of this step: the minimal information needed to design a full gamified campaign, kept as a living reference the team returns to and updates.
Our team will listen to your engagement challenges and decide if we are the best match.
Get in touchCase studies
Education And Technology
Gamified learning platform with clear learning journeys, deepening learning outcomes and reducing reliance on first-line support functions.
90%+Learners actively progressing
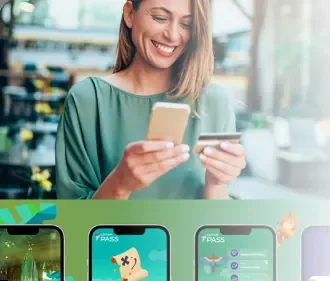

Loyalty
Gamified loyalty experience with personalized missions and rewards, leading to record-breaking engagement and conversions.
+153%Increase in credit card acquisitions
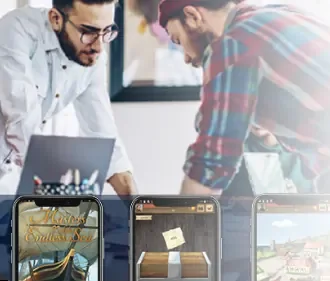

Fast-moving Consumer Goods
Gamified sales platform transforming reps into virtual traders, boosting engagement and performance across 19 countries. Best Gamification Award.
+28.6%Increase in sales revenue
For an immediate response, please send us an email via: joris@octalysisgroup.com
or
Thank you. Your message has been sent and we will reply soon.