How to Design Leaderboards That Motivate Everyone.
Let me tell you about the most common mistake in gamification, and it involves leaderboards. Product teams add a leaderboard. Top 100 users, ranked by points. It launches. The top 10 users love it. Everyone else ignores it, or worse, feels discouraged by it. Three months later, the leaderboard is a ghost town and the product team has concluded that “gamification doesn’t work for our audience.”
Gamification works fine. Your leaderboard didn’t. There’s a difference.
The problem with a single, global, points-based leaderboard is that it motivates exactly the people who don’t need motivating. Your power users are already engaged. They were going to top that leaderboard regardless. The leaderboard just gave them a way to measure it. Meanwhile, the 95% of your user base who aren’t competitive point-maximizers see a mountain they’ll never climb and disengage from the feature entirely.
I’ve been designing engagement systems for over a decade at The Octalysis Group, working with companies like eBay and Booking.com. Here’s what I’ve learned about building leaderboards that drive motivation across the full user distribution, not just the top sliver.
The Core Insight: Urgent Optimism
In her research on game design and real-world problem solving, Jane McGonigal introduced the concept of “urgent optimism”: the belief that you can succeed if you act immediately. It’s a specific emotional state. You feel capable, the goal feels reachable, and there’s time pressure that makes action feel necessary.
Traditional leaderboards destroy urgent optimism for everyone except the leaders. If you’re ranked 42,372nd and can see that the top user has accumulated 14 million points while you have 400, there’s no urgency and no optimism. There’s just resignation.
The design goal is to make every user feel like the next meaningful milestone is within reach, regardless of their absolute position. Here’s how.
Technique One: Percentile Rankings Instead of Absolute Ranks
Instead of displaying “Rank: 42,372,” display “Top 24%.” Both communicate the same data, but they produce radically different emotional responses.
“Rank 42,372” tells the user they’re nobody. “Top 24%” tells them they’re outperforming three out of four users. One is demoralizing. The other is a credible claim to status. Users who see themselves as “top 24%” are far more likely to engage further than users who see “rank 42,372.”
This works because it reframes the comparison. Absolute rank compares you to the entire user base, including the obsessives at the top. Percentile rank compares you to the average. Most users can feel good about beating the average. Most users cannot feel good about chasing someone who’s logged 400 hours in your product this month.
The Octalysis Core Drives at play here shift from pure Core Drive 2 (Development and Accomplishment, which requires visible progress) to a blend of Core Drive 2 and Core Drive 4 (Ownership and Possession, the percentile becomes something you “own” and want to protect).
Technique Two: Micro Leaderboards
One global leaderboard is a design failure. Break it into relevant subgroups.
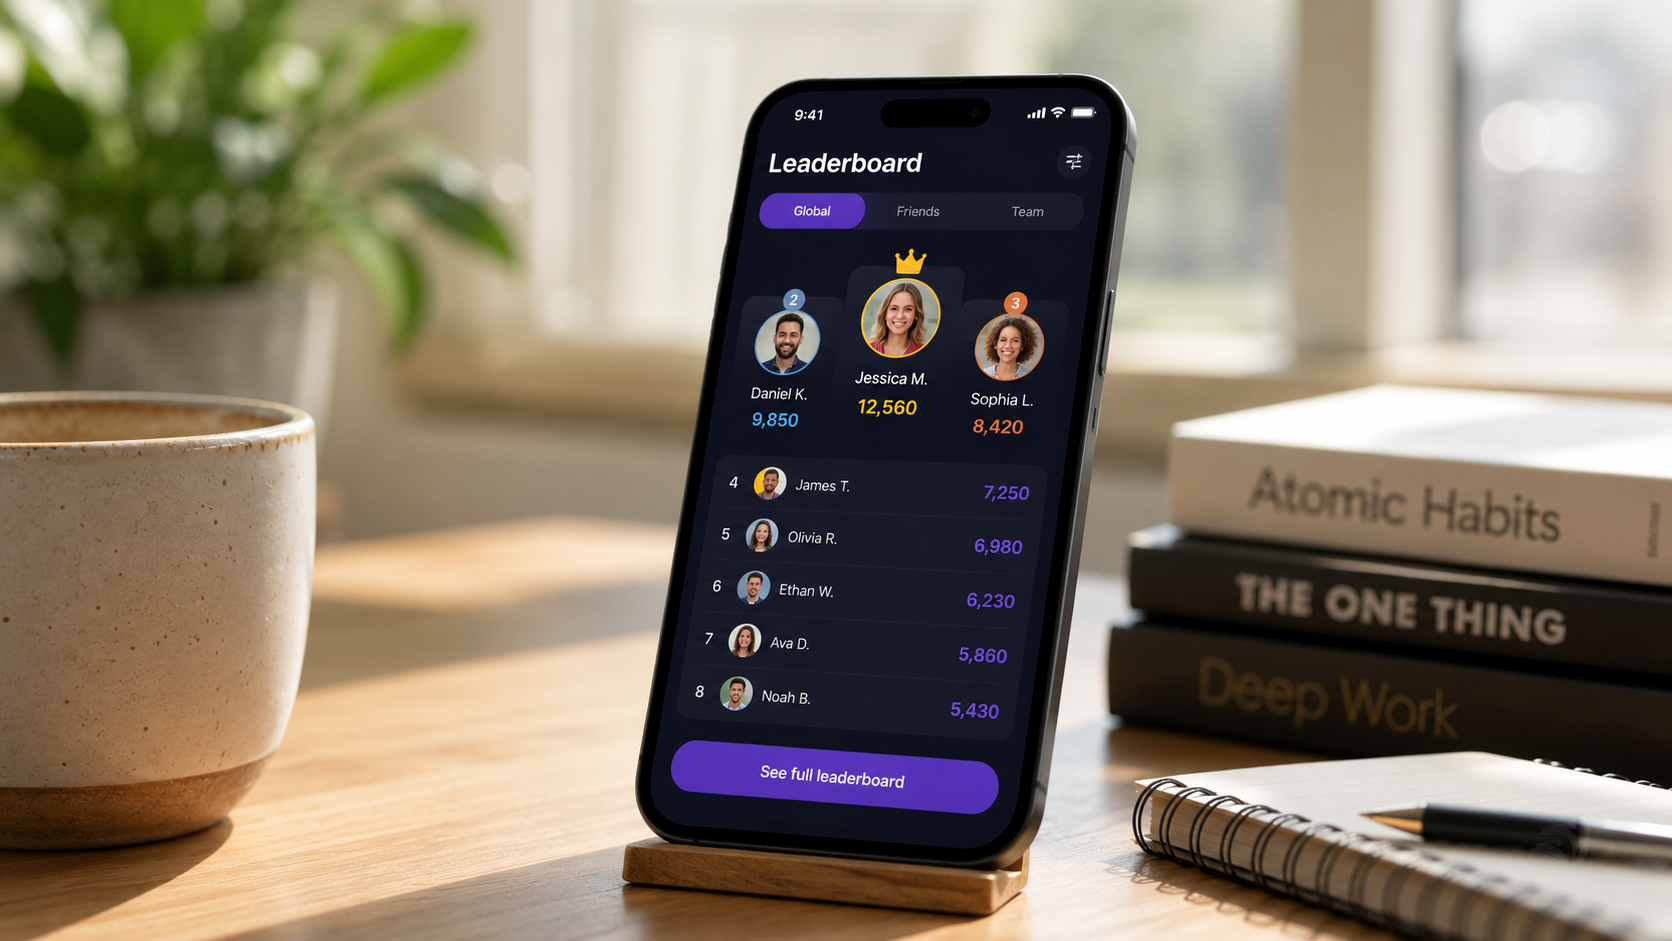
Geographic micro leaderboards rank users by city, region, or country. Industry-based ones group users by professional category. Behavioral ones group users by activity type. The goal is to make the competitive frame small enough that any user can realistically contend for the top spots.
A user who’s ranked 80,000th globally might be 7th in their city. That 7th-place position is motivating. They can see the person in 4th. They can imagine overtaking them. The competitive frame is comprehensible.
Micro leaderboards also activate Core Drive 5: Social Influence and Relatedness more effectively. Competing against people in your city or industry creates a social dimension that global rankings can’t replicate. There’s identity in the grouping.
Technique Three: Social Leaderboards
Compare users to their friends, not strangers. A social leaderboard shows you your rank within your social graph, whether that’s people you follow, people in your team, or connections imported from another platform.
The motivational dynamic here is fundamentally different from global rankings. Losing to a stranger is abstract. Losing to someone you know activates social comparison in a way that drives action. You don’t want your colleague to outrank you. You don’t want your friend to have a longer streak.
Most platforms already have social graphs. Very few use them for leaderboard design. This is low-hanging fruit that dramatically outperforms global rankings in engagement lift.
Technique Four: Time-Bounded Leaderboards
A leaderboard that runs forever is a leaderboard that eventually calcifies. Early adopters lock in the top positions. New users see ranks they can never reach. The feature stops serving anyone except the entrenched top tier.
Reset the leaderboard periodically. Weekly leaderboards give everyone a fresh start every Monday. Monthly resets create urgency around month-end. Event-based leaderboards tied to specific campaigns or challenges create spikes of competitive engagement.
The reset mechanic is important because it changes the competitive frame from an endurance contest (who’s been here longest) to a sprint (who performed best this period). Most users can’t win an endurance contest against someone who joined two years earlier. They can win a sprint.
This also introduces Core Drive 6: Scarcity and Impatience. A leaderboard that resets on Sunday night creates a time-limited opportunity. Users who care about their rank feel urgency to act now, before the window closes.
Technique Five: Show Reachable Targets, Not Unreachable Peaks
The standard leaderboard displays the top 10 or top 100. This is useful for the users in those positions. It’s counterproductive for everyone else. Seeing the performance gap between yourself and number one is not motivational. It’s a status display for the winners.
Instead, show the user their own stats and the stats of five users directly above and below them. These are their actual competitors. These are the people they can realistically overtake this week. The competitive focus stays on achievable movement, not unachievable heights.
You can still display the top 10 for status recognition (which those users have earned). But don’t make that the primary view. The primary view should be the user’s immediate competitive neighborhood.
Technique Six: Reward Movement, Not Just Position
A leaderboard that only rewards final position creates an all-or-nothing dynamic. Users who know they won’t finish in the top tier have no reason to engage with the feature at all.
Add recognition for movement. “Biggest jump this week.” “Most consistent improver.” “Best newcomer.” These categories create additional vectors for status that aren’t captured by absolute rank. A user who moved from 500th to 200th achieved something real, even if they’re not on the podium. Recognize it.
This also gives users strategic choices. Do I optimize for absolute rank, or do I try to win “most improved”? Multiple win conditions create a richer competitive landscape.
The Integration Principle
Leaderboards don’t operate in isolation. They work as part of a broader engagement architecture that includes progression systems, social features, and feedback loops.
A well-designed leaderboard amplifies existing competitive motivation. It doesn’t manufacture it from nothing. If your user base has no competitive instinct whatsoever (rare, but possible in certain contexts), no leaderboard design will save you. The feature has to fit the motivational profile of your actual users.
We’ve seen this play out across dozens of implementations. Leaderboards in sales enablement tools for Booking.com looked completely different from leaderboards in community platforms for eBay, because the user motivations were different. The design principles are universal. The specific implementation has to be contextual.
We audit leaderboard implementations against the full Octalysis Framework to identify which Core Drives are being activated and which are being neglected. Most leaderboards activate two Core Drives: Accomplishment and Social Influence. The best ones optimize for clever use of scarcity and empowerment too. Our case studies show the difference in engagement outcomes.
The Bottom Line
A leaderboard is not a feature. It’s a motivational architecture. The data structure is the easy part. The behavioral design is the hard part.
If your leaderboard motivates your top 5% and depresses everyone else, you don’t have a leaderboard problem. You have a design problem that happens to be expressed through a leaderboard. Fix the design, and the feature transforms from a vanity metric for your power users into an engagement engine for your entire base.
Need help with that? Contact us!